
The social media metrics to track are the ones that connect your posts to business outcomes: reach and impressions to see visibility, engagement and saves to see interest, link clicks and profile visits to see intent, and enquiries, leads and sales to see results. Follower counts and likes are easy to see but rarely explain whether the work is paying off. A good measurement plan starts with a goal, picks a handful of metrics for each stage of the customer journey, and reviews them on a regular schedule. This guide explains each group of metrics, how to calculate the common ones, which numbers to treat with caution, and how to turn it all into a one-page monthly report.
Which social media metrics should you track first?
Start by writing down your goal in one line. If the goal is awareness, track reach, impressions and follower growth among the right audience. If the goal is leads, track profile visits, link clicks, messages and form submissions. If it is sales, track orders, revenue and cost per acquisition. Metrics without a goal become a pile of numbers.
For most small businesses, a short list is plenty: reach, engagement rate, saves and shares, link clicks, messages or enquiries, and conversions. Add cost per result if you run paid campaigns. Each of these should be reviewed against your previous month, not against another brand's screenshots.
Group them by stage so the story is easy to read. Awareness metrics answer whether people see you. Interest metrics answer whether they care. Action metrics answer whether they do something. If a number does not belong to a stage, ask why you are collecting it. A short, well organised list is easier to act on than a long dashboard that no one opens.
What are reach and impressions, and how are they different?
Reach counts the number of unique accounts that saw your content. Impressions count the total number of times it was displayed, including repeats to the same person. If one person sees a post three times, reach is one and impressions are three. Platforms define and label these slightly differently, so read the definitions in each analytics tool.
Reach tells you how big your audience for a post was, while impressions combined with reach suggest how often people see you. Rising reach with falling engagement can mean you are reaching the wrong people, or that the content is not interesting enough. Watch the split between followers and non-followers to see whether you are discovered beyond your current audience. Many platforms also show audience location and age, which helps you check that a Mumbai restaurant is not attracting mostly viewers from far outside delivery range.
How do you calculate engagement rate?
Engagement rate is the number of interactions divided by an audience measure, multiplied by 100. Interactions usually include likes, comments, shares and saves. You can divide by followers, which is simple but ignores how many people actually saw the post, or divide by reach, which is often more informative. Pick one method and use it consistently.
For example, if a Reel got 120 interactions and reached 4,000 accounts, the rate by reach is 3 percent. Compare your own posts over time rather than chasing someone else's number. Weighted views help too: a save or share usually signals stronger interest than a like, so note how many of each you earn. Comments that ask a question or tag a friend are stronger still, because they show a real person thinking about buying or recommending.
Interactions worth separating:
What do clicks, profile visits and messages tell you?
These are intent signals. A profile visit shows curiosity. A tap on the website link, the call button or the directions button shows someone is considering action. A direct message or WhatsApp enquiry shows a willing prospect. For many Indian businesses, messages are more valuable than website clicks because buyers prefer to talk first.
Track these weekly and tag them to content where you can. If one type of Reel keeps producing messages, make more of it. Also note the time it takes you to reply, since an enquiry answered in ten minutes behaves very differently from one answered next morning. Use UTM parameters on links so Google Analytics shows which posts bring visitors. Our GA4 guide for small businesses shows how to read social traffic and conversions.
How do you measure leads and sales from social media?
Connect social activity to your lead records. Add a field in your enquiry sheet or CRM for source, and ask every new customer how they found you. Use conversion tracking on your website for forms, calls and purchases, and a click-to-message source tag for chat enquiries. Without this, social media will always look less valuable than it really is.
Remember that people often see you on social media, then search your name on Google and convert later. Direct attribution will undercount social media influence. Read our guide on marketing attribution models to understand why, and use a mix of tracked data and customer answers to judge impact.
FAQs: How do you measure leads and sales from social media?
What is a lead quality score?
It is a simple internal rating, such as hot, warm or cold, assigned after a first conversation. Tracking it by source shows which channels bring serious buyers, not just enquiries.
How long should I wait before judging a campaign?
Allow at least a few weeks of consistent activity, longer for considered purchases. Judging after a few days often mistakes normal fluctuation for a trend.
Which paid social metrics matter?
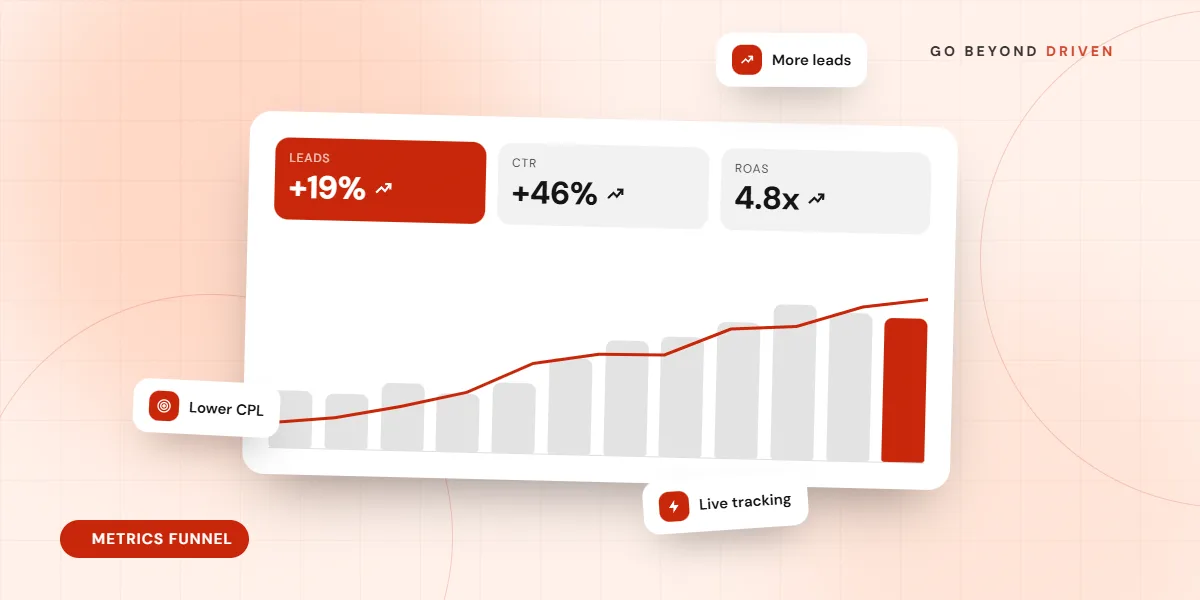
For ads, watch cost per result, click-through rate, frequency, cost per thousand impressions and, most importantly, conversion rate and cost per qualified lead or sale. Click-through rate tells you whether the creative attracts attention; conversion rate tells you whether the page and offer persuade. A high click rate with weak conversions often signals a poor landing page or a mismatched audience.
Frequency shows how often the same person has seen an ad; a steady rise paired with falling results suggests creative fatigue. Compare ads with one change at a time. Our guide on how to reduce cost per lead shows which levers to pull when numbers disappoint.

Which vanity metrics should you treat with caution?
Follower count, total likes and video views without watch time can look impressive while telling you little. A large audience of the wrong people will not buy. Views on a short clip may include very brief plays. None of these are useless, but they should not be the headline of your report.
Use them as context. Follower growth matters when the new followers match your buyers' location and interests. Video views matter when paired with average watch time and completion rate. If a number cannot change a decision you would make, give it less space in your report. A good test is to ask what you would do differently if the figure doubled or halved. If the answer is nothing, it belongs in an appendix, not on the first page.
Also be careful with averages. A single viral Reel can lift the monthly average and hide the fact that most posts did poorly. Look at the median post, the best three and the worst three, and write one line on why each performed as it did.
How do you build a simple monthly social media report?
Keep it to one page. Start with the goal and the result: leads, enquiries, sales, or reach, depending on the objective. Add five to eight key metrics with last month's numbers and this month's, the best and weakest posts, and what you learned. End with two or three decisions for next month, such as more behind the scenes Reels or a revised offer.
Use tools that suit your size. Native insights from Instagram, Facebook and LinkedIn are free, and a spreadsheet is enough to start. Save screenshots of your analytics each month, since some tools show limited history. Our guide to content marketing metrics offers more ideas for reporting beyond social platforms.
A one-page report should show:
Final thoughts
The social media metrics to track are the few that move you closer to a customer: visibility, interest, intent and results. Choose them to fit your goal, measure them consistently and let them guide what you make next. If you would like help setting up tracking and reports that reflect real business outcomes, Go Beyond Driven can review your accounts in a free marketing audit or support you through our social media marketing services. Call +91 91378 79539 or email gobeyonddriven@gmail.com.