
ROAS vs ROI is a question every advertiser meets sooner or later. ROAS, or return on ad spend, is the revenue you earn for every rupee spent on advertising. ROI, or return on investment, is the profit you make compared with everything you spent, including product cost, fees and overheads. ROAS tells you how efficient your ads are at producing sales. ROI tells you whether the business actually made money. A campaign can show a strong ROAS and still lose money if margins are thin, and a modest ROAS can be very profitable for a high margin service. This guide explains both formulas, shows worked examples in rupees and helps you choose the right target.
What is ROAS and how do you calculate it?
ROAS is revenue from ads divided by the cost of those ads. If you spend Rs 50,000 on ads and they generate Rs 2,00,000 in sales, your ROAS is 4, often written as 4x or 400 percent. It is easy to read from Google Ads and Meta Ads reports, which is why it is the favourite metric for daily campaign decisions.
ROAS only looks at ad spend and revenue. It ignores what the product cost, the shipping, payment gateway charges, returns, staff time and agency fees. It also depends on attribution, so the number you see in an ad platform may differ from your actual order records. Treat it as a measure of ad efficiency, not as a measure of business profit.
Platforms usually report a conversion value for each order, so check that it matches your store or billing records. If the pixel counts the order total including GST and shipping, ROAS looks better than it should. Cancelled orders and cash on delivery refusals, which are common in India, can also inflate platform revenue unless you compare against what was actually delivered and paid.
What is ROI and how is it different?
ROI is net profit divided by total investment, usually shown as a percentage. If a campaign brings Rs 2,00,000 in revenue but the product cost, delivery, fees and ad spend add up to Rs 1,50,000, profit is Rs 50,000. Divided by the Rs 1,50,000 invested, ROI is about 33 percent. It answers the question: after everything, was it worth it?
ROI can cover a single campaign, a whole channel or the entire business, and you decide which costs to include. That flexibility is useful but also a source of confusion, so agree on the definition in advance. Finance teams and owners usually care about ROI, while media buyers watch ROAS because it responds quickly to changes in bids and creative.
The two connect through margin. If you know your margin, you can translate any ROAS into a rough profit figure: revenue times margin, minus ad spend. That bridge is the most useful thing to build in a simple spreadsheet, because it lets everyone read the same campaign report and reach the same conclusion about whether it is worth continuing.
Costs that ROAS ignores but ROI includes:
ROAS vs ROI: what is the main difference?
ROAS compares revenue with ad spend only. ROI compares profit with total cost. So ROAS answers how hard each ad rupee works, and ROI answers whether the business makes money. Both matter, and they often move in different directions when margins, discounts or return rates change.
Consider two shops spending Rs 10,000 on ads. A jewellery seller earns Rs 40,000 in sales at a 25 percent margin, so gross profit is Rs 10,000 before ads, leaving nothing after the ad spend. A software tool earns Rs 40,000 at an 80 percent margin, leaving Rs 22,000 after the ad cost. Both have a ROAS of 4, but only one makes a healthy return. The example is simplified and ignores other overheads, yet it shows why copying another business's target ROAS can be dangerous.
The reverse also happens. A premium interior design studio might see a ROAS of only 2 on its first project, because enquiries convert slowly, yet each customer is worth a large project and referrals. Judged on ROAS alone the campaign looks weak, but judged on ROI over the full customer relationship it can be one of the best investments the studio makes.
How do you find your break-even ROAS?
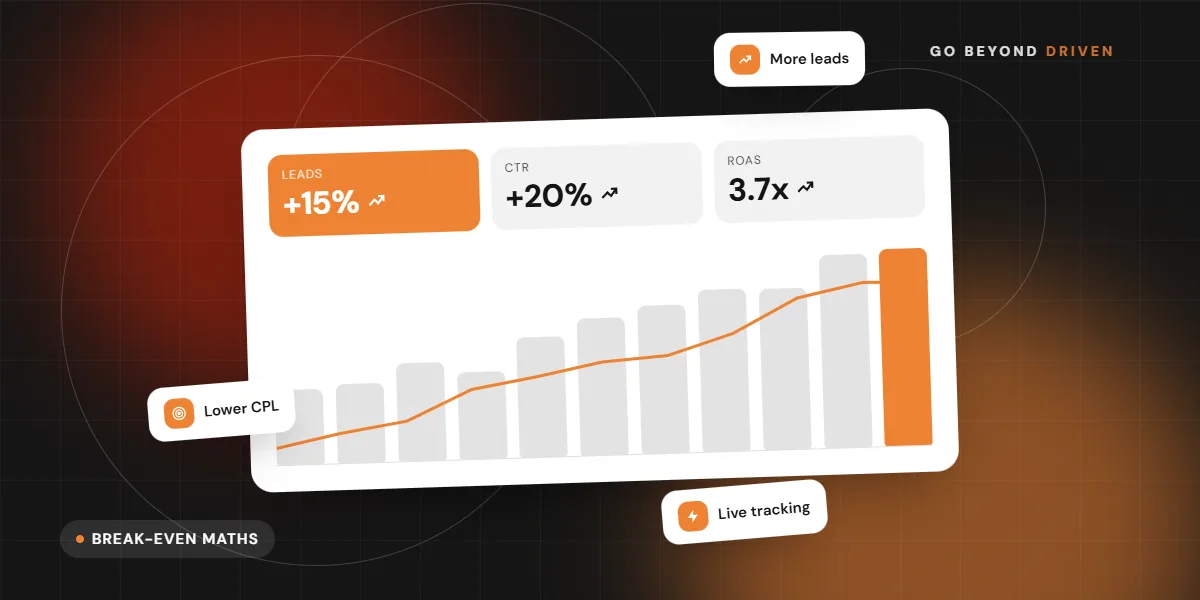
Break-even ROAS is the point where gross profit exactly covers ad spend. The formula is 1 divided by your profit margin. If your margin after product and delivery costs is 40 percent, break-even ROAS is 2.5, because you need Rs 2.50 in revenue to earn Rs 1 of margin. Anything above 2.5 earns a profit before other overheads, anything below loses money.
Use contribution margin rather than headline margin, subtracting discounts, returns, payment charges and delivery. Then add a cushion for fixed costs and a profit goal. If you want 20 percent net profit on top, your target ROAS needs to be well above break-even. Our performance marketing for D2C brands guide shows how this plays out for online stores.
FAQs: How do you find your break-even ROAS?
What if my margin changes by product?
Set separate targets by product or category. A single account wide ROAS target hides the fact that low margin products may lose money at the same ROAS that makes high margin items profitable.
Should I include GST in revenue?
Use revenue excluding GST for a true picture, because the tax is collected for the government and is not your income. Be consistent between revenue and cost figures, and write down the definition you chose so that reports stay comparable month to month.
Which metric should you track for lead generation?
For leads, there is no direct sale in the ad platform, so ROAS needs an assigned value. Assign a value to each lead type based on close rate and average deal size. If one in ten leads becomes a Rs 1,00,000 customer, each lead is worth roughly Rs 10,000. You can then compare cost per lead with that value to get a working ROAS.
ROI becomes visible only after sales close, so connect your CRM to the ad data. A real estate or coaching business may wait weeks for the final result, so track leading indicators such as cost per qualified lead and site visits in the meantime. Our marketing attribution models guide explains why different reports show different numbers.
When does ROAS mislead you?
ROAS can look great when campaigns target people who would have bought anyway, such as brand searches and remarketing audiences. Those campaigns capture existing demand, so their ROAS is high but their contribution is smaller than it appears. Meanwhile, prospecting campaigns look weaker even though they create new customers.
It also misleads when attribution windows are long, returns are high, or repeat purchases are ignored. A first order ROAS of 1.5 can still be profitable if customers reorder, so look at customer lifetime value. Our retargeting ads strategy post discusses balancing these audiences.
Signs ROAS alone may be misleading you:
How do you set sensible targets for ROAS and ROI?
Start from your numbers, not industry averages. Calculate contribution margin, break-even ROAS and the profit you need. Set a minimum ROAS floor below which a campaign is paused, and a target level for scaling. Review them whenever prices, discounts or costs change, such as during Diwali sales when discounts shrink margins. Share the targets with whoever manages the ads, so that nobody optimises toward a number that was set a year ago.
Use the ad platform's target ROAS bidding only when you have enough conversion data and have entered realistic values. Setting the number too high starves delivery, while setting it too low spends freely. Compare ROAS by campaign type, and let blended figures, such as total revenue divided by total ad spend, guide business level decisions, as discussed in our Google Ads vs Meta Ads comparison.
Final thoughts
Track ROAS to steer campaigns day to day, and track ROI to confirm that the business makes money. Know your margin, calculate break-even ROAS, assign values to leads and review the numbers with your accounts team. If you want help turning your reports into profit-based targets, Go Beyond Driven offers a free marketing audit, and our performance marketing agency team can set up tracking that connects spend to revenue.